Diagnose CDN routing and connectivity
Open CDN Debug on the hostname that delivers the content, from the network where the symptom appears. The page shows the CDB edge server that handled the request and the client network for that request.
Edge server for the request
The HTML page and JSON endpoint provide the same types of diagnostic information. Use the hostname configured for the CDN resource — the domain through which the content is delivered.
https://cdn.example.com/.well-known/cdn-debug
https://cdn.example.com/.well-known/cdn-debug/json
Replace cdn.example.com with the CDN hostname. The debug endpoint returns information about the corresponding CDN resource only when opened on that hostname.
Read these objects in the JSON response:
| Object | What it shows |
|---|---|
request_info | Domain, client IP, protocol, method, and path |
client_headers | Client ASN and location |
server_headers | Edge server name, address, and location |
other_headers | Request headers captured with this request |
The HTML page also shows the request, client, and server details.


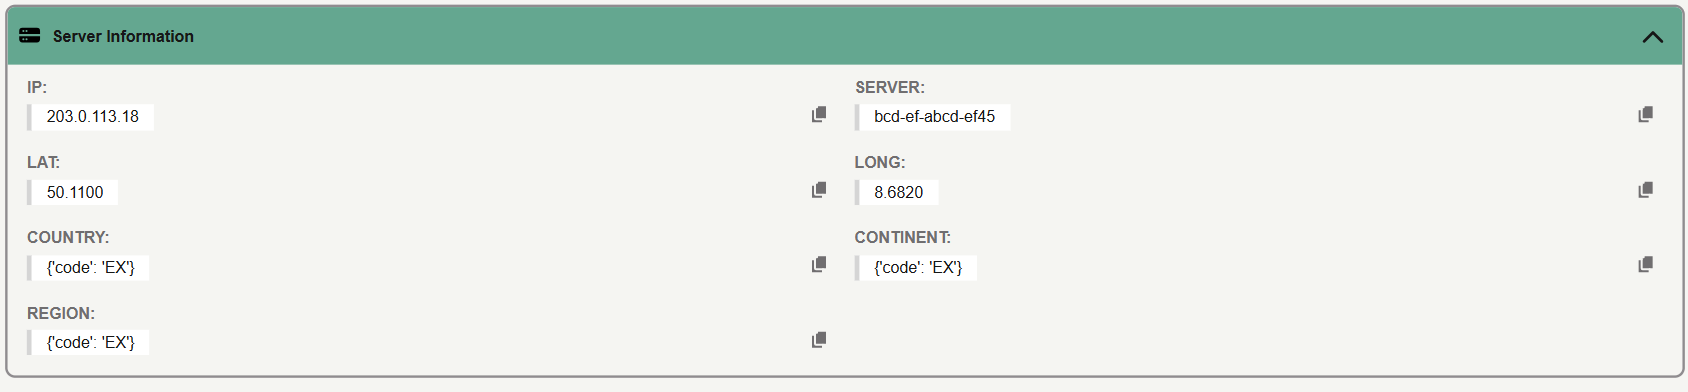
server_headers.server identifies the responding edge server. The server_headers object also contains its address and location.
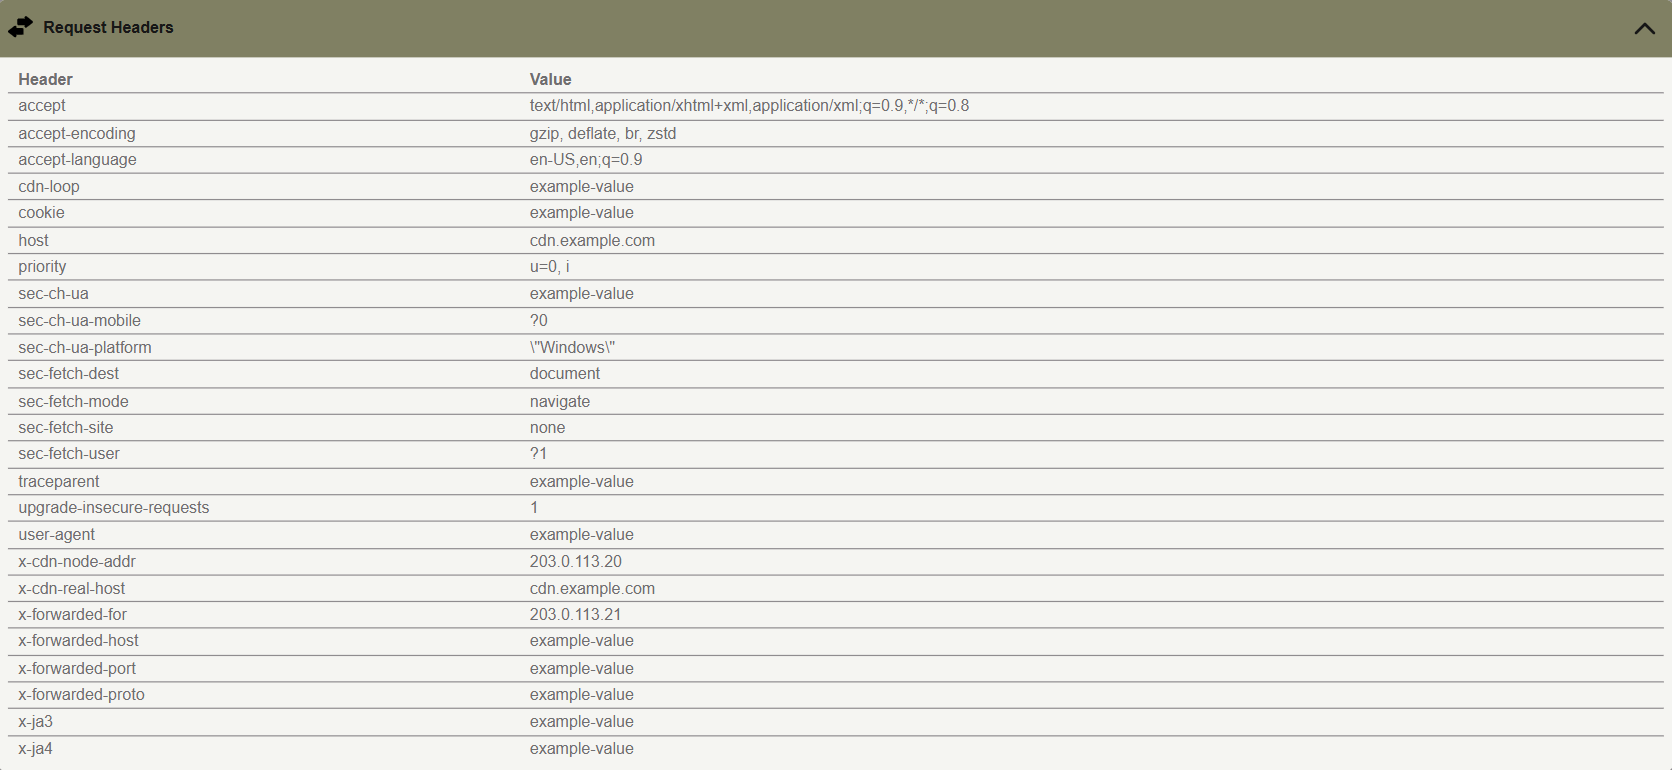
other_headers contains the headers captured with the request.
Results from two networks
When users experience delays on one network but not another, check CDN Debug from both networks.
- Open the JSON URL from each network.
- Compare the client ASN, the edge server name, and the location.
- Run Speedtest from each network.
- Compare Ping and Download.
- If the edge server is the expected one and the file is still slow, check cache status and time to first byte in the video delivery guide.
Different edge servers indicate that the requests were handled by different CDN nodes, but do not necessarily indicate a routing issue. A higher Ping indicates greater latency to the diagnostic endpoint during that test.
The following example uses illustrative values, not actual CDB measurements.
| Network A | Network B | |
|---|---|---|
| Client location | Warsaw | Warsaw |
| Edge location | Warsaw | Frankfurt |
| Ping | 8 ms | 38 ms |
| Download | 420 Mbps | 110 Mbps |
Network B has higher latency and lower download throughput in this test. These differences warrant further investigation but do not necessarily indicate a routing fault.
Result interpretation
Use the following table to interpret common results and decide what to check next.
| Observation | Reading | Next check |
|---|---|---|
| Different networks reach different edges | The requests were handled by different CDN nodes | Compare Ping and Download from both networks |
| One network shows a higher Ping | The measured latency to the serving edge was higher | Repeat the test and compare the runs |
| The edge city is far from the client | Geographic distance alone does not determine latency | Use Ping, not the city alone |
| Ping is low and the file is still slow | The debug host responded quickly. File delivery can still depend on cache or origin | Check cache status and time to first byte |
| Repeated checks disagree | Results can vary between requests due to changes in the serving edge, network conditions, or local test conditions | Compare several runs |
Speedtest measurements
On the HTML page, open Speedtest and click Start test. Ping, Jitter, Download, and Upload come from /ping, /download, and /upload on the same CDN host.
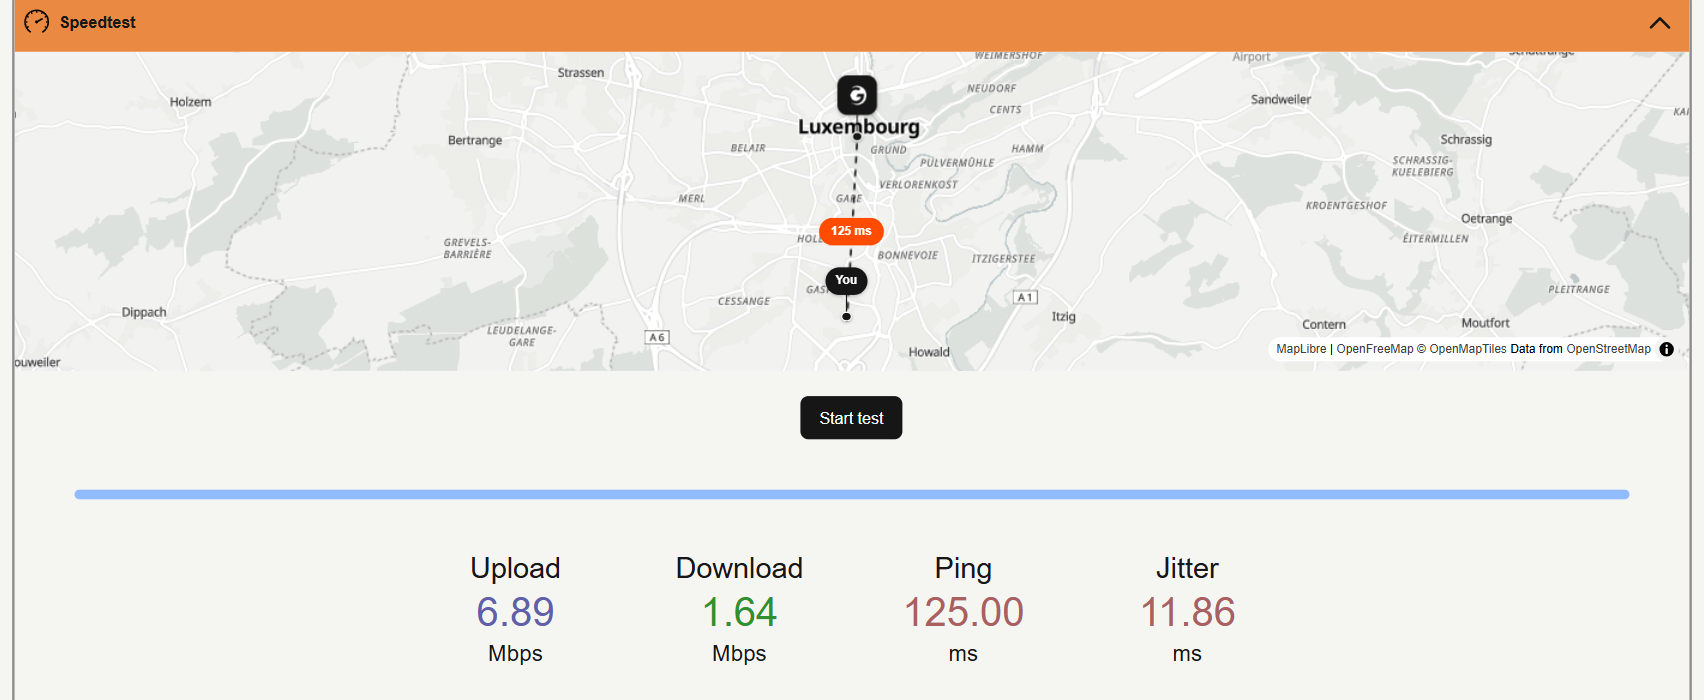
Speedtest measures connectivity to the diagnostic endpoint. Its Ping, Jitter, Download, and Upload results do not necessarily reflect the performance of individual files delivered through the CDN.
Attach the JSON body to a CDB Support request when the comparison above is not enough. The body includes client and server addresses.